Spreadsheets have long been an indispensable tool in architecture, engineering, and construction (AEC) practice. From tracking project budgets to organising complex building data, many AEC firms rely on spreadsheet software daily. In fact, Excel is so entrenched that “most architects use Excel at least once a week”, despite few having formal training in it. Surveys and industry reports reinforce this heavy reliance. One recent construction industry guide bluntly noted that the primary business system for managing projects is often Microsoft Excel. Even as modern, specialised tools emerge, spreadsheets remain ubiquitous due to their flexibility, familiarity, and low cost.
Whether you’re an operations manager tracking fees, a project lead managing resourcing, or a principal juggling fee proposals and business development, spreadsheets likely play a central role in how your firm runs. This guide is written for AEC professionals who manage the commercial side of projects and need tools that support clear, consistent decision-making across time, cost, and delivery.
However, not all spreadsheet platforms are equal. This article examines the prominent spreadsheet software used in AEC firms - chiefly Microsoft Excel, Google Sheets, and Apple Numbers (with a look at others like Smartsheet) - and analyses the features AEC professionals find most useful. We also highlight some powerful but underutilised features that could boost productivity in AEC workflows.
Common Spreadsheet Software in AEC
Microsoft Excel - The Industry Standard: By far the most widely used spreadsheet tool in AEC is Microsoft Excel. Excel’s dominance in construction and engineering is well-documented, with one 2023 industry review observing that “the reality is the primary business system used to manage these projects is Microsoft Excel”. Its popularity stems from a combination of power and familiarity: nearly everyone in an architecture or engineering office has Excel on their computer and knows the basics. Excel is used for almost every business function in civil engineering and construction, including planning, contracts, budgeting, design calculations, quantity takeoffs, scheduling, and more. In architecture firms, Excel often underpins project finance management (fee budgets, expense tracking), resource planning, and even design-related tasks like floor area calculations or code checklists.
Key reasons for Excel’s entrenched use in AEC include:
Flexibility & “Programming” Capabilities: Perhaps Excel’s greatest strength is its flexibility. Users can set up nearly any structure or process they need - from a simple fee schedule to a multi-sheet project management workbook - without requiring IT support. Advanced users even tap into Macros and VBA scripting to automate repetitive tasks. For instance, an architect might write a macro to generate a project fee report or to batch-update drawing registers, saving hours of manual work. This do-it-yourself programmability lets small firms build custom “apps” in Excel tailored to their workflows.
- Universality: Excel’s format is virtually a lingua franca - files can be easily shared, and everyone is familiar with the interface. This universal compatibility is a big win when collaborating with clients or consultants who might not have specialised software.
- Powerful Calculation Features: Excel offers an extensive library of formulas and functions that professionals leverage for analysis. Beyond simple sums, many architects/engineers use lookup functions, logical tests, and math operations to drive complex models. Mastering functions like VLOOKUP, INDEX/MATCH, or IF can “revolutionise your data analysis” for tasks like cost estimation or structural calculations.
- Pivot Tables and Data Analysis: Excel’s PivotTable feature is prized by project managers for summarising large datasets (e.g. compiling timesheet hours or cost data across projects) into meaningful insights. These tools help uncover trends (like which project phases are consuming most hours) and guide strategic decisions.
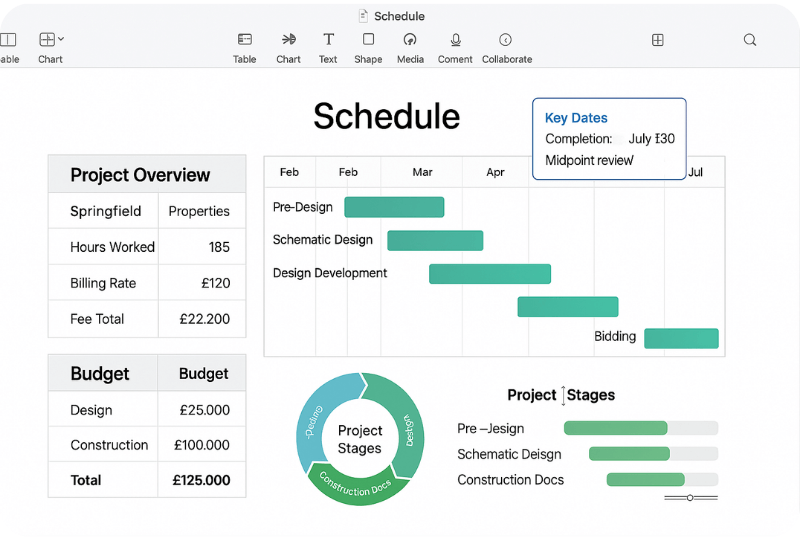
- Charts and Visualisation: With Excel, AEC teams create charts to visualise schedule progress, cash flow curves, resource allocations, and more. The ability to turn raw numbers into graphs or sparklines helps in communicating with clients and stakeholders. Many firms build internal dashboards in Excel, combining tables and charts to monitor project health.
- Flexibility & “Programming” Capabilities: Perhaps Excel’s greatest strength is its flexibility. Users can set up nearly any structure or process they need - from a simple fee schedule to a multi-sheet project management workbook - without requiring IT support. Advanced users even tap into Macros and VBA scripting to automate repetitive tasks. For instance, an architect might write a macro to generate a project fee report or to batch-update drawing registers, saving hours of manual work. This do-it-yourself programmability lets small firms build custom “apps” in Excel tailored to their workflows.
It’s no surprise, then, that Excel is deeply ingrained in AEC workflows. One architecture firm owner running a 20+ person practice described their software mix and noted they still rely on Excel “to track project payments [and] administrative stuff” alongside other tools. Many mid-sized firms start off managing projects with QuickBooks for accounting plus Excel for everything else, a combination so common that industry experts casually observe that “many [small firms] are using QuickBooks and spreadsheets” as their main management toolkit. Even as firms grow, leaving Excel behind can be hard - a testament to its utility.
Google Sheets - Cloud Collaboration: Google Sheets is the other major player, increasingly used especially by distributed teams and smaller firms. Sheets provides spreadsheet functionality similar to Excel but in a cloud-based, browser interface. Its killer feature is real-time collaboration: multiple team members can edit a budget or schedule simultaneously and see changes live. This is hugely beneficial for AEC teams spread across offices or working from home. For example, a project manager and a finance assistant can jointly update a fee-tracking sheet in Google Sheets without emailing files back and forth. Real-time editing, combined with built-in version history (every change is saved and can be reviewed), means Google Sheets excels at scenarios where many contributors input data.
AEC adoption of Google Sheets has grown in the past few years, especially for team-based tasks like schedule updates, design coordination logs, or cost tracking that benefit from cloud access. Some architecture practices have fully embraced Google Workspace; one firm noted they use “Google Sheets +…Trello + Notion + [even] notebooks and pens” in a hybrid mix for organising team tasks. Another industry discussion highlighted that using online spreadsheet templates is a simple, cost-effective method for tracking time on projects - Google Sheets being a prime choice for such templates due to its accessibility. The ease of sharing a Sheets file via a link (no installed software needed) makes it easy to involve external collaborators too, like consultants or clients, in a controlled way.
In terms of features, Google Sheets offers a robust set of functions (nearly all Excel formulas have equivalents) and even unique capabilities like GoogleFinance() for live data or seamless Google Forms integration to collect data into a sheet. It also supports add-ons and Google Apps Script for automation. However, Sheets does have some limitations in AEC use: very large datasets or heavy computational tasks can bog it down (Excel’s desktop engine still outperforms for massive files), and certain advanced Excel features (e.g. intricate pivot charts, VBA macros) aren’t available or are less powerful in Sheets. Despite this, for many AEC teams the trade-off of slightly fewer advanced features is worth the gains in collaboration and cloud convenience. Google Sheets tends to be especially popular in small-to-mid sized firms (under ~20 staff) and startups, or for specific collaborative workflows within larger organisations.
Apple Numbers - Niche Use in Mac-Centric Circles: Apple Numbers is the default spreadsheet program for macOS and iOS, offered free by Apple. In AEC, Numbers is far less commonly used than Excel or Sheets, but it does have a modest following, especially among individual architects or small design studios that work exclusively on Macs. Numbers is known for its clean interface and attractive output, which can be useful when making presentation-ready tables or graphs (for example, an architect creating a neatly formatted fee proposal or design schedule to show a client). It allows flexible layout on a canvas, which designers appreciate for visual polish.
That said, Numbers lacks many advanced features and cross-platform compatibility of Excel/Sheets. Complex engineering calculations or large datasets can be cumbersome in Numbers, and its function library is not as extensive. Collaboration is possible via iCloud, but in practice it’s limited to Mac/iOS users and not as seamless as Google’s real-time editing. Because most large AEC firms use Windows or cross-platform tools, Numbers remains a niche - used in some Mac-loving architecture offices for light-duty tasks, but seldom adopted firm-wide in larger practices. Many Mac-using architects still install Excel due to industry expectations. Thus, while Numbers can be a handy tool for a solo architect or internal use (especially if visual styling is a priority), it’s generally considered the least essential of the “big three” spreadsheet softwares in AEC.
Other Spreadsheet Tools - Smartsheet and Beyond: Aside from the traditional spreadsheets, AEC firms sometimes turn to spreadsheet-like specialised platforms. A notable example is Smartsheet, a cloud project management tool with a spreadsheet interface. Smartsheet has gained traction in construction and architecture project management for its ability to combine familiar spreadsheet-style editing with project scheduling features (like interactive Gantt charts, dependencies, and automation). One architecture firm principal shared that they use “various Excel and Word templates for the business side of things, and Smartsheet for project management,” finding that combination effective. Smartsheet is often praised for accommodating external collaborators (clients or consultants can update a row or view the schedule without needing full licenses) and for its pre-built templates geared to projects. Essentially, it takes the spreadsheet concept and adapts it specifically for task tracking, schedules, and project dashboards - which is very appealing in AEC where multi-company project teams must stay aligned.
Other “spreadsheet alternatives” occasionally used in AEC include Airtable (a database-spreadsheet hybrid used for organising project data or contacts with more structure) and LibreOffice Calc (an open-source Excel alternative sometimes used if budgets are very tight or for compatibility with certain systems). Even certain BIM data exchanges use spreadsheet formats - for instance, the COBie standard for exchanging building asset data is essentially delivered as an Excel workbook of information. These specialised cases aside, Excel, Google Sheets, and occasionally Smartsheet cover the vast majority of spreadsheet use in modern AEC firms.
Most Used Features in AEC Spreadsheets
Why do architects, engineers, and construction managers turn to spreadsheets so often? AEC professionals have identified a set of core features that make spreadsheets incredibly useful for their work. Below we outline the most-used and most useful spreadsheet features in AEC, along with examples of how firms apply them:
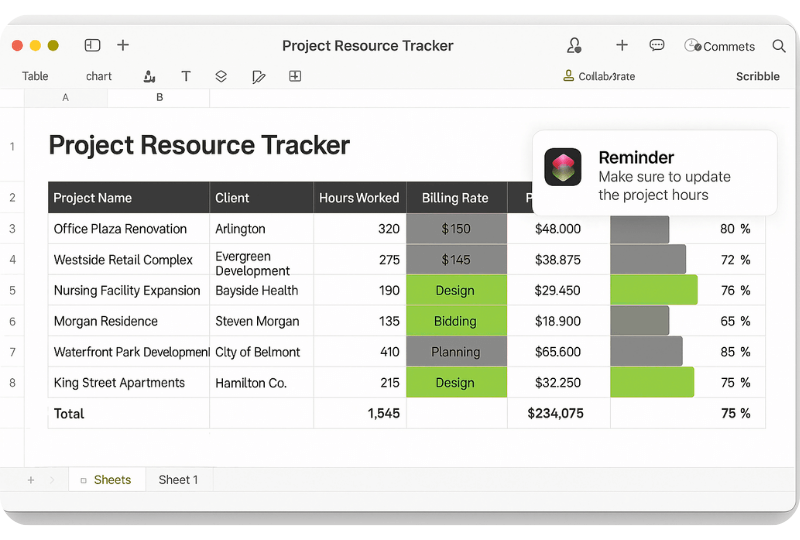
- Mathematical and Database Functions: At their heart, spreadsheets are calculation tools. AEC teams make heavy use of formulas to automate calculations that would otherwise be tedious or prone to error. Common basic functions include SUM and AVERAGE (to total up costs, or compute average unit rates, etc.), but many users quickly move to more advanced formulas. For instance, architects often use lookup functions (VLOOKUP or the more robust INDEX/MATCH) to pull data from one table into another - useful for things like automatically fetching employee billing rates from a staff table into a project budget sheet. An industry tutorial for construction pros notes that understanding advanced Excel functions like VLOOKUP can “revolutionise your data analysis”. These functions turn a basic spreadsheet into a mini database. Engineers might use trigonometric and logical functions to design structural calculations, while contractors use statistical functions to analyse risk or contingency. The ability to build these custom formulas (and now, dynamic array formulas in newer Excel versions) gives spreadsheets unmatched versatility for AEC computations. Many “essential Excel skills for construction” lists put advanced formulas at the top.
- Pivot Tables and Data Summaries: When dealing with large datasets - for example, a timesheet table of thousands of entries or a cost plan with hundreds of line items - pivot tables are a go-to feature. Pivot tables allow AEC managers to slice and dice data quickly: How many hours did each team member log this month? Which project phase is consuming the most budget? With a pivot table, these answers come in seconds, without writing complex formulas. You can drag-and-drop fields (like Phase, Person, Task, etc.) to group and total data in various ways. This is extremely useful for project performance reviews and benchmarking. If an architecture firm tracks all projects in a master spreadsheet, a pivot table can instantly summarise key metrics by project type, by client, by year, and so on. It essentially provides ad-hoc reporting. Given its value, it’s no surprise pivot tables are listed among the “top features for construction teams” using Excel. Google Sheets also offers pivot tables (web-based) which smaller firms use to similar effect for simpler datasets.
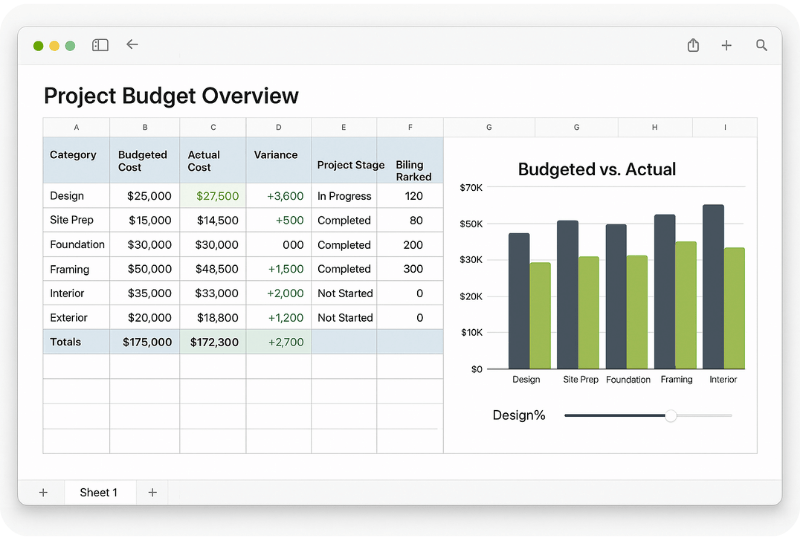
- Conditional Formatting and Data Visualisation: AEC projects are visual by nature, and spreadsheets help visualise data for easier understanding. Conditional formatting is heavily used to add color-coded highlights to cells based on their values. For example, a project manager might set a rule to shade any budget cell red if it exceeds the initial fee, flagging cost overruns at a glance. Schedules in a spreadsheet can highlight overdue tasks in bold red. These visual cues make spreadsheets into dashboards. Additionally, architects and engineers use the chart tools to create graphs: cash flow curves over time, bar charts of resource allocation, pie charts of cost breakdowns, etc. Excel’s charting capabilities are quite advanced - everything from simple line graphs to scatter plots or even 3D surface charts for certain analyses. Data visualisation is listed as a key skill for construction professionals in Excel because it “transforms numbers into actionable insights with charts”. An example in practice: a contractor may maintain a safety incident log in Excel and then chart incident frequency by month to spot trends and respond proactively. Visualisation features help translate the spreadsheet’s raw data into a story or decision-support tool.
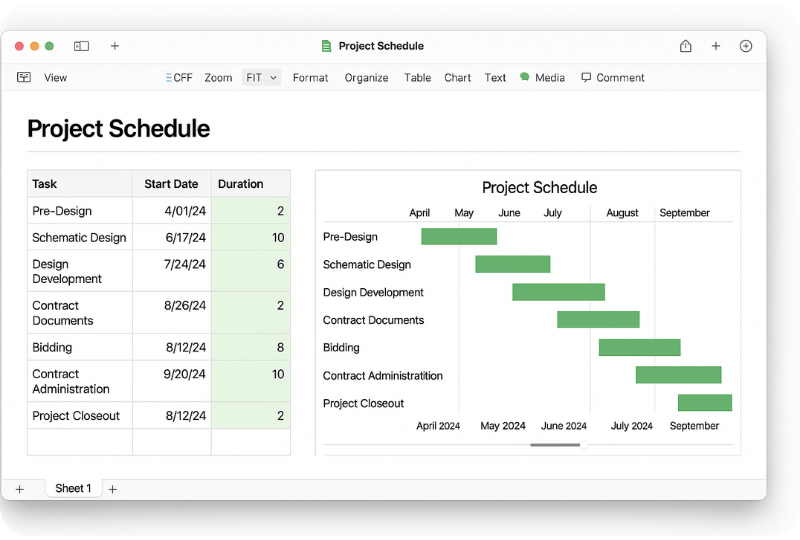
- Project Scheduling and Gantt Charts: Surprisingly to some, many AEC teams use spreadsheets for scheduling tasks and phases, even though dedicated scheduling tools (like MS Project or Primavera) exist. Excel in particular is often bent into a makeshift scheduling tool. By entering task start and end dates in cells and applying bar-style conditional formatting or formulas, users create Gantt chart visuals right in Excel. In fact, Excel “Gantt chart” templates are widely available for architects and contractors. The process usually involves listing tasks with start/end dates, then using a stacked bar chart or conditional formatted timeline cells to represent the schedule graphically. While these spreadsheet Gantts are static and lack the auto-adjusting dependencies of real scheduling software, they are good enough for many short-term plans. Construction teams like them for the convenience - as noted in one comparison, “the Gantt chart feature in Excel is actually a carefully formatted bar chart… useful for delivery teams,” albeit without automated logic. Smaller architecture firms find an Excel timeline perfectly adequate for internal scheduling of design milestones or staffing plans. Google Sheets can do similar via templates, and Smartsheet explicitly builds interactive Gantt functionality on top of a spreadsheet interface. The key appeal is that team members can update progress by simply editing a cell, and everyone can view a simple chart without needing specialised software.
- Collaboration and Sharing Features: Collaboration might not be a “feature” in the traditional sense, but it’s one of the most valued aspects of spreadsheets in AEC. Excel and Google Sheets each offer ways for multiple people to work together: Google Sheets allows multi-user real-time editing by default, which is fantastic for project teams updating a document simultaneously (say, an integrated project checklist being filled out by consultants from different firms). Meanwhile, modern Office 365 Excel has introduced co-authoring as well - if the file is on OneDrive/SharePoint, several users can edit together live. Even outside live collaboration, the simplicity of sharing spreadsheets makes them a pragmatic tool. AIA practice coaches observe that many small firms still simply email an Excel file around or store it on a shared drive as their method of disseminating project information. The consistency of everyone using the same spreadsheet ensures “everyone is on the same page” in terms of data. This is especially important in AEC where miscommunication can cause costly errors. Spreadsheets also serve as a common data exchange format. For instance, many consultants will accept cost estimates or schedules in Excel because they can open and manipulate it as needed. This universality and ease of sharing is frequently cited as Excel’s “big win” for construction teams.
- Templates and Reusability: Over years of practice, many firms develop their own Excel or Sheets templates that become essential tools. For example, an architecture studio might have a standard “Fee Calculation Worksheet” in Excel that, given project parameters, auto-calculates a suggested fee based on past project data. (Notably, the Royal Institute of British Architects (RIBA) even provides a fee calculator that exports breakdowns to Excel for sharing with clients.) Likewise, templates for timesheets, expense reports, project work plans, drawing registers, and more are rampant. These templates encode industry knowledge and save time - staff aren’t reinventing the wheel for each project. In some cases, template spreadsheets are shared across the industry: one example is a “small practice management” Google Sheets template circulated online to help small firms manage accounts, timesheets, and projects in one place. The prevalence of templates underscores how spreadsheets are a foundation for standardised processes in AEC, from design workflows to business operations. Once a template is created, features like Excel’s data validation (to restrict inputs to valid choices) or cell protections (to lock formula cells from editing) help ensure it can be reused reliably by others in the firm.
- Automation and Scripting: While not every firm taps into these, the ability to automate tasks is a powerful feature for those who do. Excel’s VBA (Visual Basic for Applications) and Google Sheets’ Apps Script let tech-savvy team members create custom functions or automate multi-step procedures. In an engineering firm, a VBA macro might be written to generate a print-ready report of structural calculations from raw input data, saving hours of manual formatting. In an architecture office, a script could automatically email the team a copy of the project status spreadsheet every Friday. Macros are highlighted as an advanced skill for construction professionals, with experts noting they “save time and reduce human error” by automating repetitive tasks. Google Sheets’ scripts similarly can perform tasks like notifying users of approaching deadlines in a schedule sheet or integrating with other Google services (e.g., sending form responses to a sheet and then triggering email summaries). Although relatively few architects/engineers are trained programmers, those firms that harness these automation features often see significant productivity boosts - which is why this is an area considered underutilised (more on that below).
In summary, AEC firms use spreadsheet features in a very broad way - from simple table calculations to serving as lightweight databases, schedulers, and reporting tools. The most useful features are those that provide flexibility and clarity: the ability to compute, summarise, visualise, and share important project information easily. It’s a testament to spreadsheets’ versatility that a single Excel file might simultaneously function as a timesheet tracker, a fee calculator, and a Gantt chart - all-in-one. Few other tools offer that swiss-army-knife utility.
Underappreciated Features and Hidden Gems in Spreadsheet Use
Given how heavily spreadsheets are used, one might assume AEC teams squeeze every drop of capability from them. In reality, many powerful spreadsheet features go underutilised in architectural and engineering practices. Here are some sometimes overlooked or underappreciated features that industry experts highlight, which could deliver even more value if adopted widely:
- Advanced Data Analysis Tools (Power Query, Power Pivot): AEC firms dealing with large datasets could benefit from Excel’s modern data tools, yet many practitioners stick to manual copy-pasting out of habit. Power Query (also known as Get & Transform) allows users to pull in data from external sources (CSV files, databases, BIM exports) and automatically clean/format it for analysis - all with a point-and-click interface. For example, a contractor could use Power Query to import updated cost data every week and merge it into their Excel cost report, rather than manually inputting updates. Power Pivot extends Excel’s analytical power by letting users create relationships between tables and build more complex pivot analyses (essentially bringing database-grade Business Intelligence into Excel). These tools can connect, report & share Excel data across an organisation more easily, addressing some spreadsheet limitations like data silos. However, they “can be tricky to learn” and many AEC professionals haven’t taken advantage of them yet. For firms willing to invest in a bit of training, these features are hidden gems for reducing manual data wrangling.
- Macros and Scripting (Making Spreadsheets Do the Work): As mentioned, only a minority of AEC spreadsheet users create their own macros or scripts - but those who do often discover they can automate away drudgery. Something as simple as a macro to sort and format a project expense table into a client-ready summary can save hours. AEC tech bloggers urge professionals to explore VBA or Google Apps Script, noting that automating repetitive calculations or formatting not only saves time but also reduces human error. With today’s resources (many online guides and even AI assistants that can suggest code), creating basic automation is more accessible than ever. Yet, this remains underappreciated - many architects still spend late nights manually updating Excel schedules or fee tables, unaware that a few lines of code could handle the heavy lifting. Embracing these automation features can free up valuable time for design and analysis.
- Data Validation and Structured Data Entry: One source of spreadsheet chaos in firms is inconsistent data entry - e.g., one project manager types “Building 1” while another types “Bldg 1” or a typo, making analysis harder. Data validation is an Excel/Google Sheets feature that allows the creator to restrict inputs (for instance, providing a dropdown list of allowed project phase names, or ensuring a date field only contains dates). This is hugely helpful for maintaining data quality, yet many spreadsheets in practice don’t use it, relying on manual discipline instead. Setting up validation rules and structured tables can transform a messy sheet into a reliable database. Similarly, using Named Ranges (assigning logical names to cells or ranges) is often overlooked - it makes formulas much easier to read and maintain (“=Revenue - Expenses” is clearer than “=C10 - D10”). An architectural technologist writing about “beautiful spreadsheets” emphasises using such features to make spreadsheets more robust and user-friendly. By underestimating these, teams may be missing out on easier collaboration and fewer errors.
- Pivot Charts, Slicers, and Interactive Dashboards: Many AEC spreadsheet users know about pivot tables but haven’t explored pivot charts and slicers. Pivot charts tie directly to pivot table data, allowing dynamic graphs that update as you filter or change the pivot - excellent for interactive reporting. Slicers (buttons that filter pivot tables/charts with a click) can turn an Excel sheet into a mini-dashboard where, for example, a user can click a slicer to see project financials by year or by project manager. These features can impress clients or principals by making reports more interactive. They are part of Excel’s arsenal that often goes untapped in architecture firms, where static charts are more common. Introducing these could elevate how firms report on KPIs or project metrics internally.
- Integration with Other AEC Tools: Spreadsheets don’t have to exist in isolation. A perhaps underutilised capability is linking or integrating spreadsheets with other software. For example, many Building Information Modeling (BIM) tools (like Autodesk Revit) can export schedules or quantities to Excel; forward-thinking teams then link those Excel exports to their main project spreadsheet so that design data flows into financial or scheduling data. Likewise, Excel can pull live data from databases or APIs - potentially connecting to project management systems or accounting systems to automatically update information. An advanced use case in construction is using Excel for Critical Path Method (CPM) analysis by importing schedule data - yes, even sophisticated scheduling calculations can be done in Excel. While not every firm will do this, acknowledging that spreadsheets can integrate with BIM, accounting, or other platforms (via CSV imports, ODBC links, etc.) suggests opportunities. Google Sheets similarly has an API and can be integrated into automation platforms (like feeding site data from a Google Form into a master sheet and then into a dashboard). Many AEC firms haven’t scratched the surface of these integrations, often because of lack of awareness or IT support, making this an area of future potential.
- Co-authoring in Excel and Cloud Adoption: Until recently, the lack of real-time collaboration in Excel was a reason some moved to Google Sheets. Now that Excel (with Office 365) supports co-authoring, it’s an underpublicised feature that could bring reluctant users back or improve workflows in firms already using Excel. Multiple architects can edit the same budget file simultaneously if it’s set up on OneDrive/SharePoint - no more “file locked” issues or emailing versions. This feature is still underused, possibly because many firms haven’t updated their habits or are unaware of the capability. Embracing it could combine Excel’s power with Google Sheets’ collaborative ease, which is especially relevant as remote and hybrid work become permanent in AEC. The pandemic accelerated cloud adoption, so leveraging these newer features of Excel Online (or the web version of Excel) is a way to modernise spreadsheet use.
- Apple Numbers Specific Tricks: For those who do use Apple Numbers, there are a few neat features that might be underutilised even by fans - for instance, Numbers allows multiple tables on one sheet canvas, which can be useful for creating well-organised reports (e.g., placing a summary table next to a detailed table for printing a one-page report). It also has a feature where you can create forms on iPhone/iPad that feed into a Numbers spreadsheet - potentially useful for site data collection by architects on an iPad. These aren’t widely known, and given the small user base, they remain niche. Still, they are examples of how each platform has its own hidden gems that could save time.
- AI Features in Excel and Google Sheets: Both platforms are rolling out AI assistants designed to save time and improve accuracy.
- Excel Copilot (part of Microsoft 365) allows users to ask questions in plain English, such as "What were our most profitable project phases last year?", and receive dynamic responses. It can also generate formulas and build pivot tables automatically.
- Google Sheets' "Help me organise" suggests headers, formats, and autofill content based on the structure and context of your sheet. It can create structured tables and apply best-practice formatting in seconds. These features are still new, but they promise to reshape how AEC teams work with data. Their effectiveness depends on maintaining clean, structured spreadsheets, a good reason to prioritise spreadsheet hygiene now.
In essence, while AEC professionals get great mileage out of spreadsheets already, there’s still untapped potential. Many rely on a fraction of the capabilities - typically basic formulas and manual editing - whereas features like automation, validation, and integration could significantly enhance accuracy and efficiency. With the continued emphasis on data-driven practice in architecture (for example, calls for architects to adopt more data and analytics in decision-making), mastering these advanced spreadsheet features is a relatively accessible step in that direction. Firms that invest in training staff on these tools or encourage “power users” to set up smarter spreadsheets often find it pays off in fewer errors and streamlined processes - a competitive edge in delivering projects on time and on budget.
Cautionary Note: The Limits of Spreadsheets in AEC
No discussion of spreadsheet use in AEC is complete without acknowledging the pitfalls. Spreadsheets are powerful, but they can also introduce problems if over-relied upon. Industry veterans sometimes refer to “Excel Hell” - a situation where critical business processes depend on a tangle of spreadsheets, leading to inefficiencies and errors. Architecture and engineering firms have fallen into some of these common traps:
- Human Error and Lack of Validation: Spreadsheets are prone to user error. A small mis-typed formula or an incorrect cell entry can cascade into major errors. Unlike purpose-built databases, Excel doesn’t enforce data types or consistency by default. As one data consultancy noted, Excel’s greatest strength - flexibility - is also a vulnerability: it “opens the door to increased human error, with users able to apply their own interpretation of key reporting metrics”. Faulty formulas or copy-paste mistakes can go unnoticed until it’s too late. There have been cases of serious financial losses in construction projects traced back to a simple spreadsheet error. For AEC firms, this means that while using spreadsheets, double-checking and setting up safeguards (like those data validation rules mentioned above) are critical.
- Version Control and Collaboration Issues: Without careful management, teams can end up with multiple versions of “the truth” floating around (“Budget_v3_final_FINAL.xlsx” - we’ve all seen it). If two team members edit separate copies, consolidating changes is error-prone. This is why moving to cloud-based sheets or co-authored workbooks is important - yet many firms still use email to circulate files. A construction tech comparison pointed out that when files are stored locally with no single source of truth, “multiple versions of the same plan” cause confusion and inconsistencies. Miscommunication in AEC can be costly (e.g., someone working off an outdated spreadsheet may make decisions on wrong data). Thus, firms are increasingly trying to mitigate this by adopting central cloud storage or dedicated systems, but the risk remains a caution.
- Scalability and Time Drain: What works for a five-person firm might strain a 50-person firm. As firms grow, the volume of data and complexity of management can make pure spreadsheet-based workflows unwieldy. Manually maintaining many interlinked sheets can consume significant staff time. One UK consulting article noted that reports often “take days or weeks every month simply to create” when based on spreadsheet exports and manual assembly. This is essentially wasted effort that could be saved with more automated systems. Moreover, spreadsheets handling very large datasets (tens of thousands of rows, as sometimes happens in construction cost tracking or BIM data exports) can become slow or crash, lacking the robustness of database-backed solutions. Limited scalability is a key reason larger AEC firms invest in specialised enterprise software as they grow - though they may still export data to Excel for analysis, they try to reduce heavy reliance on fragile workbook networks.
- Not Fit for Certain Purposes: Some tasks in AEC simply outgrow spreadsheets. For instance, a true critical path construction schedule with thousands of interdependent tasks is better managed in scheduling software; using Excel would be like forcing a square peg in a round hole. Similarly, maintaining a firm-wide CRM (client relationship management) in Excel might work initially, but as contacts and interactions multiply, it can become a mess compared to a real CRM system. The risk is that firms cling to spreadsheets because they’re comfortable, even when signs indicate it’s time to migrate to more specialised tools. Awareness of this limit is important - knowing when to stick with Excel vs. when to transition to dedicated project management or database solutions can save a lot of pain. Industry bodies like RIBA and AIA have been encouraging firms to adopt more integrated digital practice tools, especially as projects and data demands increase.
It’s worth stressing that spreadsheets still have a vital place - even the most sophisticated software often allows export to Excel, which then becomes the medium for custom analysis or presentation. The goal for AEC firms is to use spreadsheets wisely: play to their strengths (flexibility, calculation, universal access) for appropriate tasks, but also recognise and mitigate their weaknesses. As one consultant succinctly put it, Excel “still has its place” in reporting and analysis, but it should augment, not hinder, modern data-driven practice. Many firms are now looking at hybrid approaches - e.g., using a centralised database or project management system for core data and then using Excel/Sheets on top of that for additional analysis and visualisation (thus minimising manual data entry and risk of errors). This way, they get the best of both worlds: the reliability of structured systems and the agility of spreadsheets.
Spreadsheet software - chiefly Microsoft Excel and its cloud-based peers Google Sheets (and to a lesser extent Apple Numbers) - continues to be a cornerstone of AEC firm operations. In the past 2-3 years, industry commentary from groups like RIBA and AIA, as well as insights from practicing architects and consultants, all point to the same reality: spreadsheets remain indispensable for architects and engineers in managing the business side of projects. From a 5-person studio in Cape Town to a 50-person firm in London or Sydney, chances are they are using Excel or Sheets to handle tasks like fee budgeting, time tracking, cost estimating, scheduling, and more on a weekly basis.
Excel’s rich feature set (formulas, pivot tables, charts, etc.) and Google Sheets’ real-time collaboration have empowered AEC teams to customise their own solutions to everyday problems. We’ve seen that many of the most-used features - calculations, data summaries, visualisations - align perfectly with the needs of project-focused businesses. And yet, many firms are only scratching the surface of what’s possible; there are advanced capabilities in these tools that could further enhance efficiency if embraced (or as we discussed, could at least prevent the common spreadsheet pitfalls).
Going forward, we can expect spreadsheets to evolve in tandem with AEC industry demands. New features (for example, Excel’s recently introduced Lambda and LET functions for custom reusable formulas, or Google’s AI-assisted “Explore” insights) will likely seep into architectural practice gradually. Moreover, as data-driven design and integrated project delivery become more prevalent, spreadsheets may serve as a bridging technology - helping firms dip their toes into data analysis before perhaps moving to more specialised platforms when needed. The key is that AEC professionals treat spreadsheets as a tool, not a crutch: incredibly useful and powerful when used appropriately, but not beyond critique or improvement.
For now, any firm looking to improve its use of spreadsheets should consider two takeaways from recent industry insights: train and trust. Train your staff (even just a bit) in those underappreciated features - the payoff in reduced errors and time saved can be huge. And trust that sometimes investing in a purpose-built solution is worth retiring a tangle of spreadsheets - but when you do, spreadsheets can still work alongside as friends, not foes, for analysis and reporting. As one architecture technology editor quipped, it’s fine to love Excel for its power and hate it for its flaws - just be sure you’re using it for the right reasons!
Fresh Projects + Spreadsheets: A Complementary Approach
Spreadsheets are undeniably powerful and familiar tools - they offer simplicity, flexibility, and low cost which is why AEC firms lean on them heavily for everything from fee proposals to tracking timesheets. However, as projects multiply and firms grow, the limitations of spreadsheet-based management (manual updates, complex formulas, siloed data) become more evident. This is where modern AEC management platforms like Fresh Projects come in as a natural next step to augment your workflow.
Fresh Projects is designed to take the heavy lifting off your spreadsheets while complementing your existing processes. It doesn’t force you to abandon spreadsheets overnight; rather, it helps you graduate from “Excel Hell” by centralising and automating the repetitive, error-prone tasks that were eating up your time. For example, instead of manually consolidating dozens of Excel files to see your overall finances, Fresh Projects provides real-time visibility over fees, time, and performance across all projects in one place. It’s like having those multiple spreadsheets talking to each other automatically - giving you insights without the tedious manual work.
Importantly, Fresh Projects recognises that many teams are comfortable with spreadsheets, and we are not here to take that away. However, unlike static tools, Fresh Projects provides live reports that are built directly into your workflow. This means there is no need to export data to Excel, no version control issues, and no delay between project activity and the information available to your team. Fresh Projects operates as a powerful engine in the background, monitoring project metrics in real time, highlighting trends early, and giving both project leads and directors immediate access to the insights they need. While spreadsheets offer flexibility, effective decision-making at scale requires visibility that is always up to date, not manually copied and pasted.
By integrating Fresh Projects alongside your spreadsheets, you get the best of both worlds - you maintain the simple workflows you’re used to, but gain a layer of intelligence and ease. You’ll spend less time wrestling with formulas or version control and more time on actual project delivery. In short, spreadsheets plus Fresh Projects together can streamline your practice with minimal disruption: keep using spreadsheets for what they do best, and let Fresh Projects smoothly handle the rest, turning your project financial management into a painless, insightful process. Simplicity, ease, and productivity are the end results when you strike this balance.
In summary, spreadsheet software in AEC is here to stay, and when wielded with knowledge of its best features (and limits), it will continue to be a key enabler of project and practice success.